
The same scopes can show two signals, such as ... wait for it ... two sine waves.
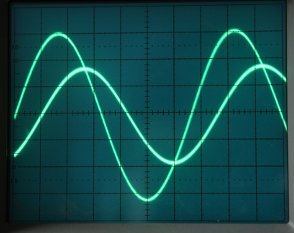
Each of the signals is the "y" value. The oscilloscope generates the "x" value: 0, .1, .2, .3, .4, ..., and displays the current value of y at that position in x. Hook up a time-varying sine wave or two, and you get the graphs above.
It gets interesting when you put the oscilloscope in X-Y mode. One input provides the y value, same as before. However, instead of the oscilloscope providing an upward counting x value, it uses the second signal for x. Now, x sweeps back and forth, say, according to a sine wave, and y changes up and down according to, say, another sine wave. The result? Lissajous Figures.
 |
| Peter's Right Arm - oh, and a Lissajous Figure |

No comments:
Post a Comment